
Demystifying Value at Risk (VaR): From Financial Theory to Excel Practice
Imagine you are managing a ₹100 Crore investment portfolio. Your board of directors asks you a simple yet high-stakes question: “In a worst-case market downturn tomorrow, how much money could we realistically lose?”
As a professional, you cannot simply say “a lot.” You need a single, scientifically backed, aggregated number that captures the total market risk across all your holdings.
This is where Value at Risk (VaR) steps in. Developed by Wall Street pioneers in the 1990s, VaR has become the universal language of risk management for global investment banks, hedge funds, and corporate treasuries alike.
Understanding the Three Pillars of VaR
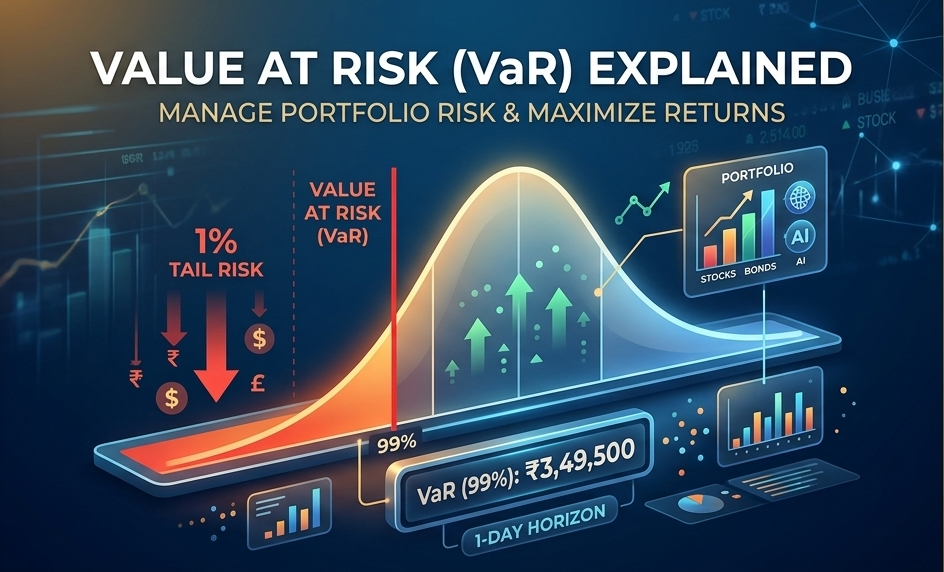
At its core, VaR is a statistical metric that states the maximum expected loss of a portfolio over a specific timeframe, under normal market conditions, given a precise level of confidence.
To interpret or write a VaR statement correctly, it must always contain three non-negotiable variables:
- A Time Horizon: The period over which the risk is measured (e.g., 1 day, 10 days, or 1 month).
- A Confidence Level: The statistical probability that your losses will not exceed the calculated threshold (typically set at 95% or 99%).
- A Monetary Value: The actual currency amount at risk.
The Golden Rule of VaR Interpretation
If a portfolio has a 1-day VaR of ₹5,00,000 at a 99% confidence level, it means:
- There is a 99% probability that the portfolio will not lose more than ₹5,00,000 tomorrow.
- Conversely, there is still a 1% probability (known as the tail risk) that the portfolio could experience a catastrophic loss exceeding ₹5,00,000.
The Two Roads to VaR: Choose Your Framework
Financial professionals utilize two classic methodologies to calculate VaR, each with its own logical assumptions and structural trade-offs.
1. The Historical Simulation Approach
- The Logic: Drops all theoretical distribution assumptions. It takes your current portfolio composition and re-runs its performance against actual, daily historical market price movements over a past window (e.g., the last 3 years).
- Pros: Captures real-world market crashes and anomalies perfectly.
- Cons: Completely backward-looking. If the past historical data doesn’t contain a major shock, your forward-looking risk assessment will be blind to it.
2. The Monte Carlo Simulation Approach
- The Logic: Uses a computer algorithm to generate thousands of randomized, hypothetical future price paths for your assets based on their statistical properties.
- Pros: Highly flexible; perfectly models non-linear financial instruments like complex derivative contracts and options.
- Cons: Incredibly data and computationally expensive.
Practical Insight to Calculate VaR (Excel Approach)
The Core Excel Formulae:
- Periodic Returns %: (CurrentPrice /Previous Price)- 1
- Standard Deviation: =STDEV.S(Range of Daily Returns)
- VAR Calculation: =PERCENTILE.INC(Array,K)
K for 95% Confidence level shall be 5%.
The calculation is conducted by considering the adjusted closing prices of the share over a five-year period. Based on this data, periodic returns are computed, followed by the calculation of the standard deviation to measure volatility. These inputs are then utilized to apply the Value at Risk (VaR) model for estimating potential downside risk,
Value at Risk is not just a formula or a statistical output, it is a decision-making tool. It brings structure to uncertainty and translates complex market movements into a number that professionals can act upon with confidence.
However, true financial insight lies in understanding its boundaries. VaR tells you how bad things can get under normal conditions, but it does not capture the full picture of extreme market events. That is why it should always be complemented with deeper analysis, stress testing, and sound judgment.
In the end, VaR doesn’t eliminate risk, it helps you see it clearly, measure it consistently, and manage it intelligently. And in a world where uncertainty is the only constant, that clarity becomes your greatest advantage.
Author: Deepanshu Jindal