
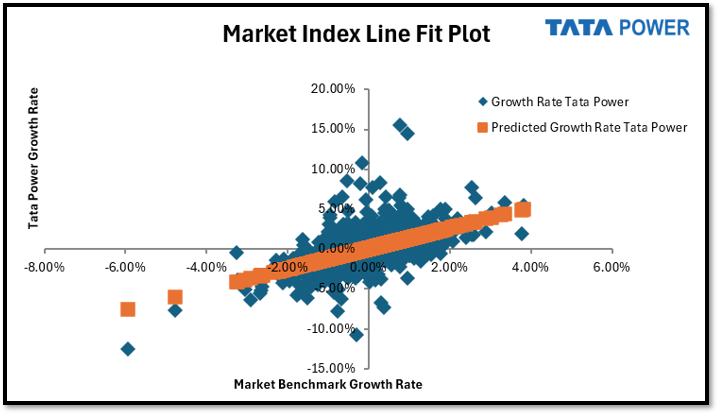
When it comes to analyzing a stock, most beginners focus heavily on price charts. While price movements are important, they don’t always tell the full story, especially when you’re trying to understand risk and market sensitivity. That’s where return-based regression analysis steps in as a far more meaningful and practical approach.
Let’s break this down in a way that actually makes sense not textbook-heavy, but insight-driven.
What is Return-Based Regression Analysis?
Return-based regression analysis is a statistical method used to study the relationship between a stock’s returns and the returns of the overall market (usually represented by an index like Nifty 50).
Instead of analyzing absolute price movements, we focus on percentage returns because that’s what investors actually earn or lose.
In simple terms, it answers one key question:
“How does this stock behave when the market moves?”
Why Returns Instead of Price?
This is where many people go wrong.
Prices are non-comparable across assets. A ₹100 stock and a ₹1,000 stock don’t mean anything in isolation. But returns? They standardize everything.
- A 5% return is meaningful regardless of stock price
- Returns eliminate scale differences
- They reflect actual investor performance
Most importantly, returns allow us to measure systematic risk, which is the core idea behind regression.
The Core Idea: Regression Equation
Return-based regression typically follows this structure:
Ri=α+βRm+ϵ
Where:
- ( Ri ) = Return of the stock
- ( Rm ) = Return of the market
- ( β ) = Sensitivity to market movements
- ( α ) = Excess return (independent of market)
- ( ϵ ) = Random error
This equation may look technical, but the interpretation is actually very intuitive.
Understanding Beta (β): The Real Hero
If there’s one output from regression that truly matters, it’s Beta (β).
Beta tells you how much the stock moves relative to the market.
- β = 1 → Stock moves exactly like the market
- β > 1 → More volatile than market
- β < 1 → Less volatile than market
- β < 0 → Moves opposite to market (rare, but interesting)
For example, if a stock has a Beta of 1.28:
When the market goes up by 1%, the stock tends to go up by ~1.28%
When the market falls by 1%, the stock may fall by ~1.28%
So, Beta is essentially a measure of systematic risk, the risk you cannot diversify away.
What About Alpha (α)?
Alpha represents the extra return generated by the stock beyond what the market explains.
- Positive Alpha → Stock is outperforming expectations
- Negative Alpha → Underperformance
However, in practical equity analysis (especially at a basic level), Alpha is often less emphasized than Beta unless you’re evaluating fund performance.
Why This Method Matters (Real Insight)
Return-based regression is not just an academic tool—it’s widely used in:
- Portfolio management
- Risk assessment
- Valuation models (like CAPM)
- Investment decision-making
Here’s why it’s powerful:
1. It captures market linkage
You understand whether your stock is market-driven or independent.
2. It helps in diversification
Combining stocks with different Betas improves portfolio balance.
3. It feeds into cost of equity
Beta is a critical input in CAPM, which is used for valuation.
Return-Based vs Price-Based Regression
Let’s clear a very common confusion.
Many beginners run regression on prices instead of returns. While that may give some correlation, it doesn’t give meaningful financial insights.
| Basis | Price-Based Regression | Return-Based Regression |
|---|---|---|
| Unit | Absolute (₹) | Percentage (%) |
| Interpretation | Weak | Strong |
| Beta relevance | Not meaningful | Accurate |
| Used by experts | No | Yes |
In simple words:
Price regression tells you movement,
Return regression tells you risk.
Practical Application (How You Can Use It)
If you’ve already worked on a share price analysis report (like many finance students do), adding return-based regression takes your work to the next level.
Here’s how you can approach it:
- Collect daily closing prices of the stock and market index
- Calculate daily returns using percentage change
- Run regression (Excel works perfectly fine)
- Extract Beta, Alpha, and R²
Even a simple Excel regression output can give you professional-level insights.
Interpreting Results Like a Pro
Let’s say your regression gives:
- Beta = 1.28
- R² = 0.65
Here’s how you should think:
- Beta 1.28 → Stock is aggressive, higher risk than market
- R² 0.65 → 65% of stock movement is explained by market
This tells you the stock is significantly influenced by market trends and carries higher systematic risk.
Common Mistakes to Avoid
Even though the concept is straightforward, execution matters.
- Using prices instead of returns
- Ignoring data consistency (same dates for stock & index)
- Not understanding Beta interpretation
- Overcomplicating Alpha
Keep it simple, but correct.
Final Thoughts
Return-based regression analysis is one of those tools that bridges the gap between theory and real-world investing. It shifts your thinking from “price movement” to “risk understanding”, which is exactly how professionals approach the market.
If you’re serious about financial analysis, this is not optional knowledge. It’s foundational.
And once you start interpreting stocks through Beta and market linkage, you’ll realize something important:
Not all volatility is bad—but unmanaged risk definitely is.